WP Umbrella captures every Warning, Notice, Parse, and Fatal error across every WordPress site you manage, in real time, surfaced in one dashboard alongside the uptime, updates, and backups you already check every morning.
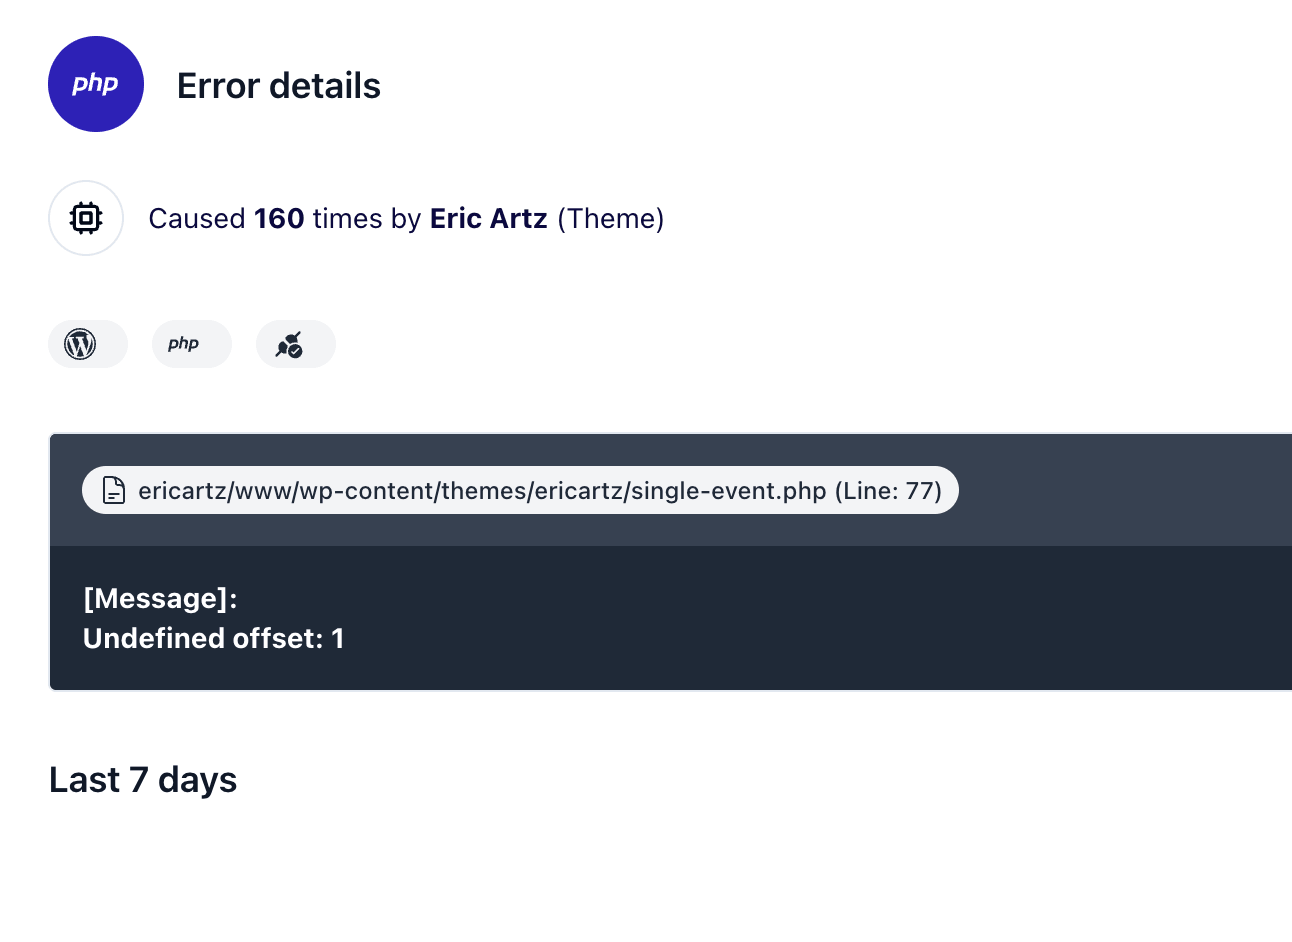
The portfolio-level rollup that flips PHP errors from per-site forensics into queue work.
If you manage ten sites, you have ten different debug.log files in ten different /wp-content/ folders, and zero shared view of what's actually breaking right now.
WP Umbrella collapses that into one portfolio screen:
The same dashboard already carries uptime, SSL, and update health, so PHP errors sit alongside the operational signals you check every morning, not in a separate console.
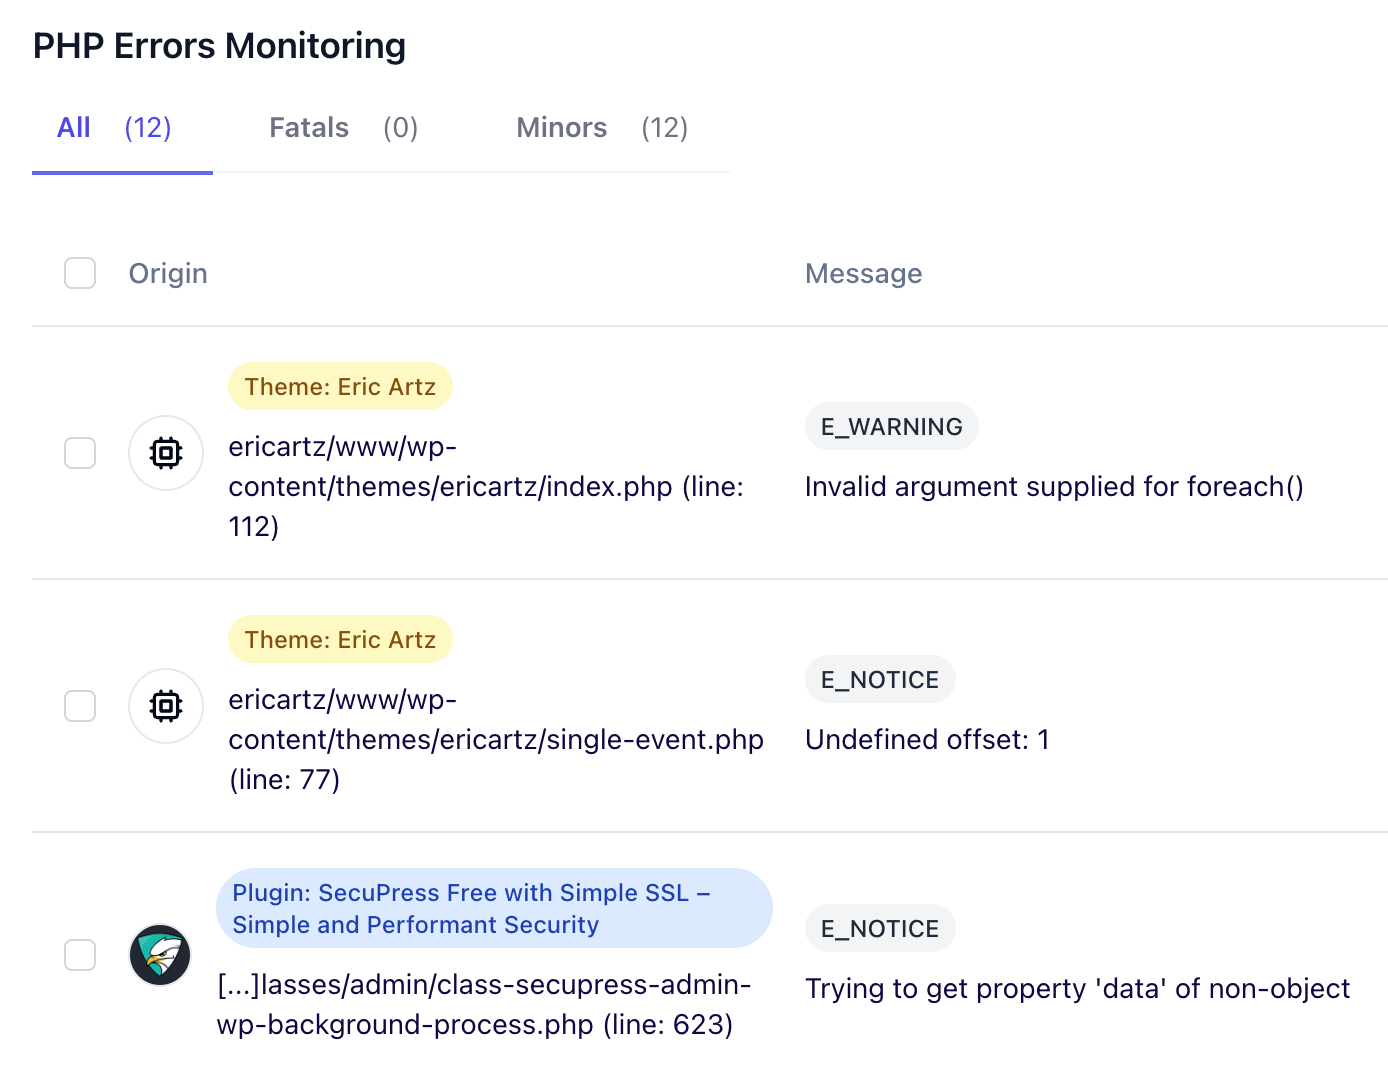
Automatic capture across plugins and themes, four severity classes, no per-site flags to set.
Connect a site and capture starts. No WP_DEBUG toggle to flip, no wp-config.php edit, no log file to tail.
WP Umbrella automatically captures PHP errors thrown by any active plugin or theme, not just WordPress core, as they happen on the live site, on every WordPress host, with no firewall rules to whitelist or server-level configuration to negotiate.
Four severity classes are kept distinct and labelled:
You see what's actually fatal and what's just chatter, instead of grepping through a flat file where everything looks the same.

Drop in the WP Umbrella plugin once. No code changes, no log shipping pipeline, no host-specific setup. Works on any WordPress host, including managed hosts like Kinsta and WP Engine.
Land on the portfolio default across every site, then drill into any single site for its full tab.
Each grouped row carries error message, file, line number, and frequency, so you can decide fix, schedule, or dismiss.
Resolved rows drop out of the active view, and reappear automatically if the same error fires again.
One row per unique error, with the frequency and timeline data you need to decide.
The same fatal firing on every page load doesn't deserve a thousand log lines. WP Umbrella groups errors by file and line, so one underlying bug is one row in your view, with a counter beside it:
Decide fix, schedule, or ignore without opening anything.
When a spike lines up with a deploy, compare the timeline against your recent update history. Mark resolved on rows you've handled and they drop out of the active queue.
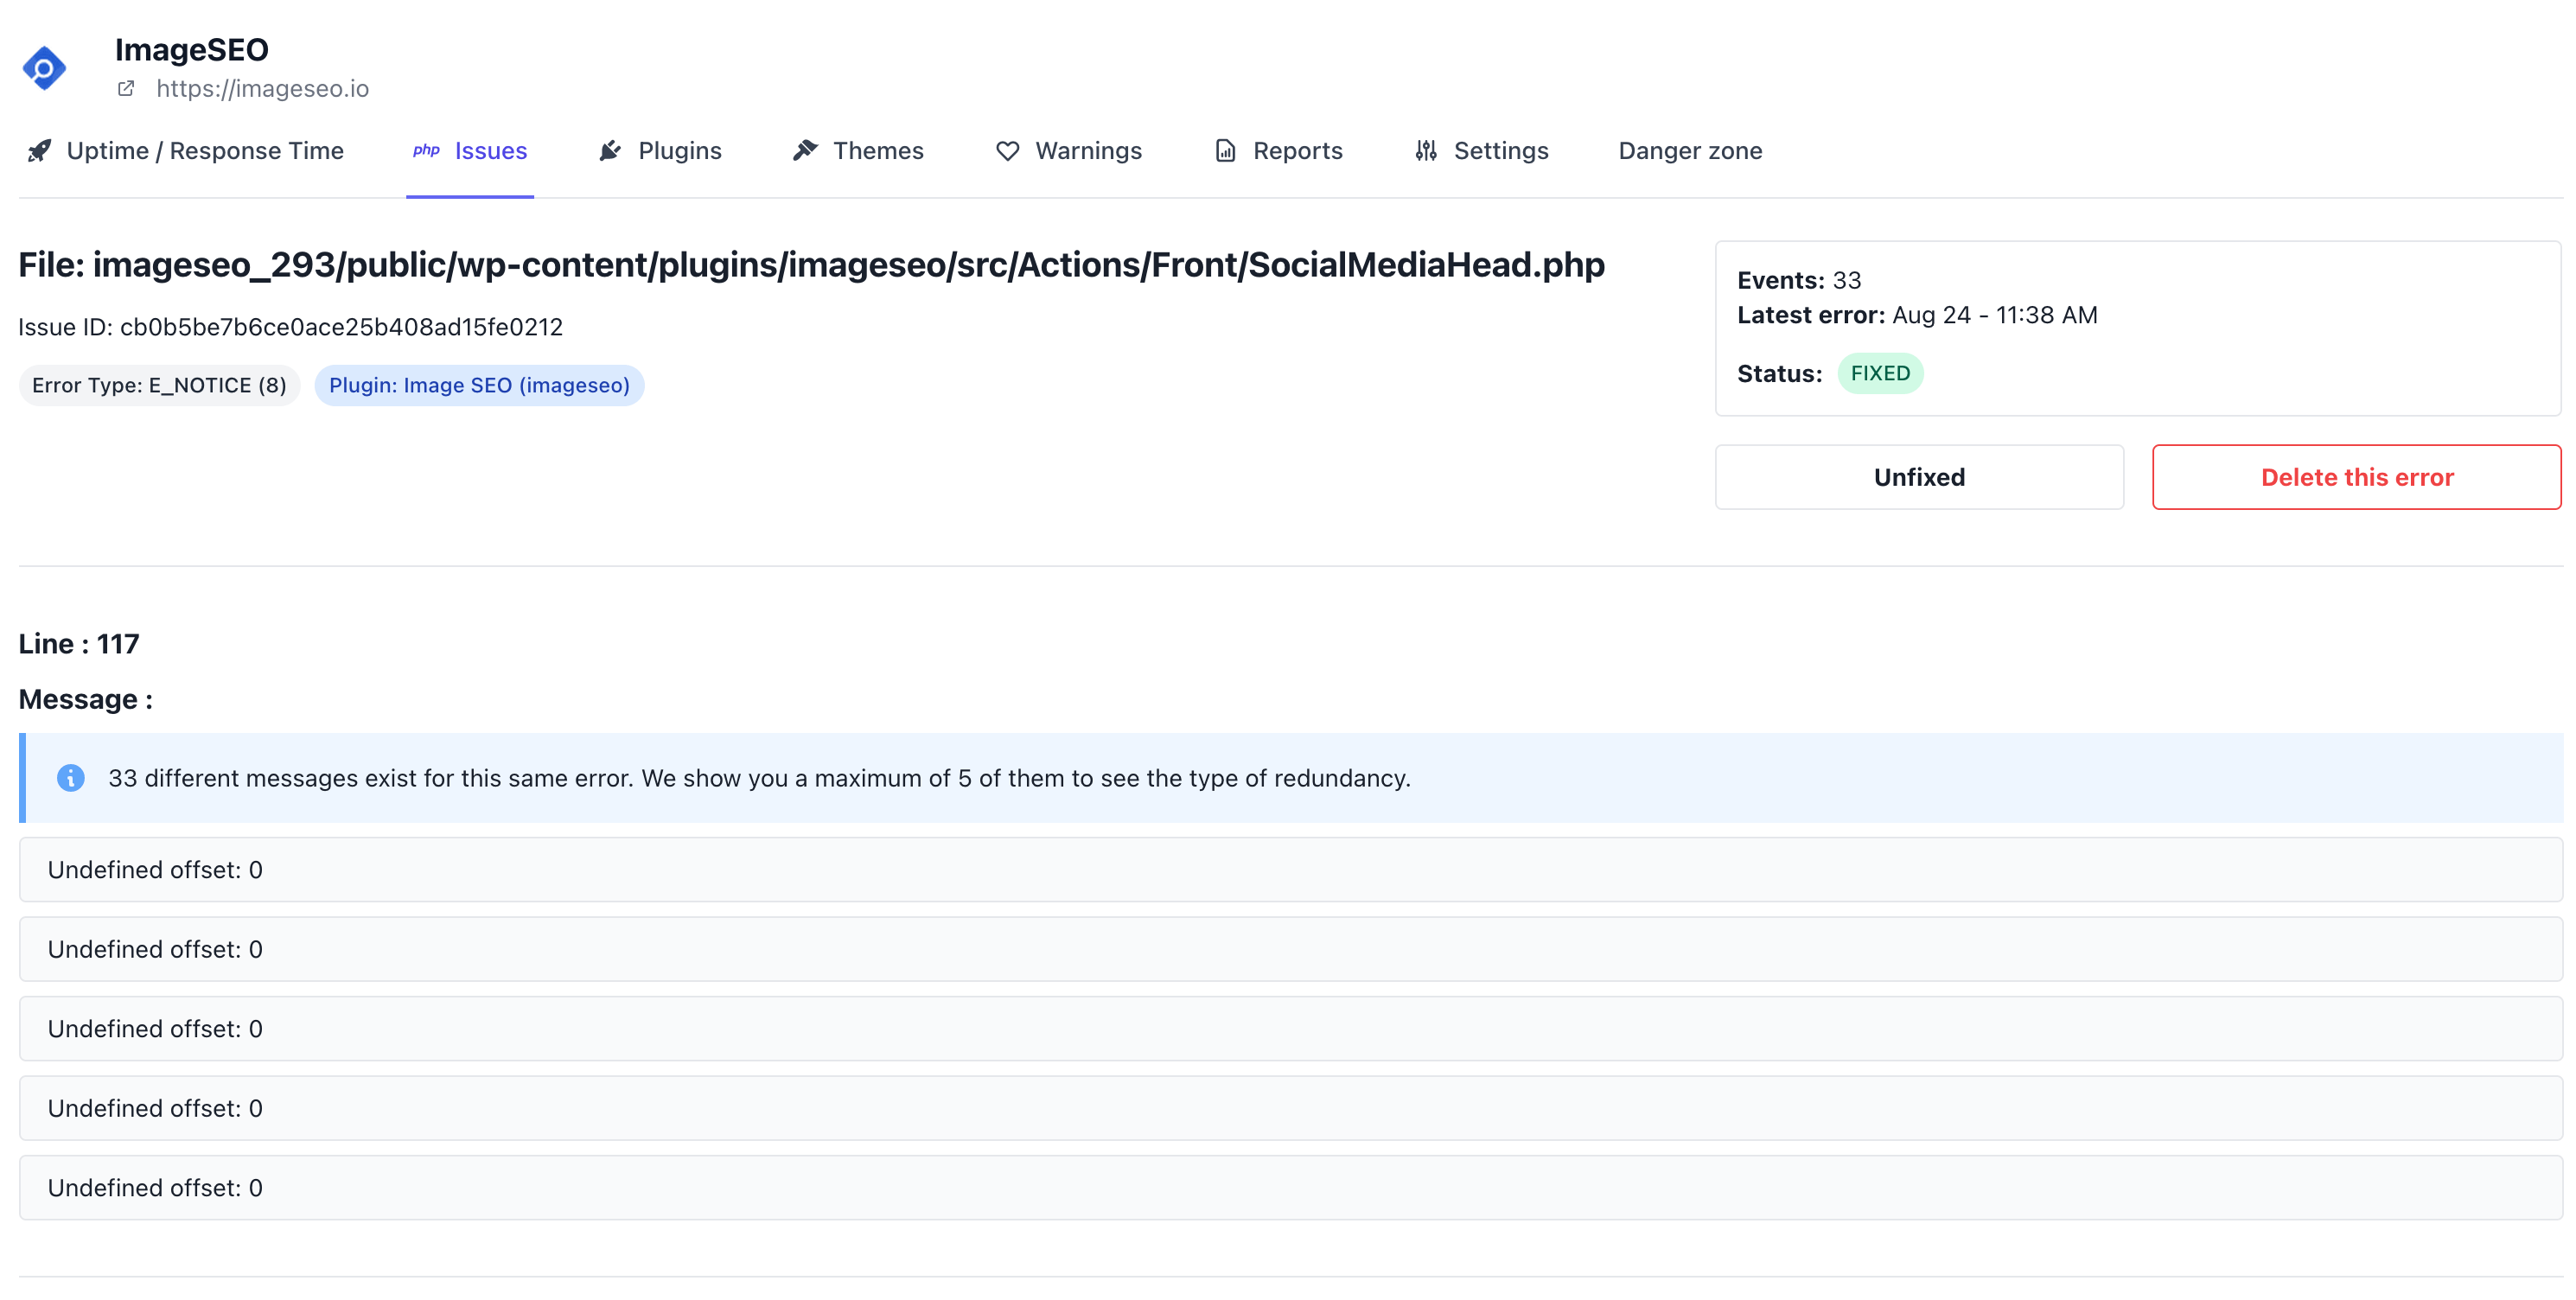
Most agencies use the dashboard as their daily triage queue.
The portfolio view sits next to uptime and updates in the morning routine:
When a spike lines up with a deploy or a plugin update, the timeline makes it obvious what changed, so the conversation with the client is "we already saw it and shipped a fix," not "thanks for letting us know."
PHP error monitoring works best when combined with:
Together, they turn PHP errors into a defensible part of your care plan.
Used daily by agencies and freelancers keeping client sites healthy at scale
I used ManageWP for years, but I felt like it just got outdated. I had issues with their support which made me lose hope and that's when I moved to WP Umbrella.
 Jeffrey · Founder @ Lytbox
When a Cloudways customer asks us what the best WordPress management tool is, we are happy to recommend WP Umbrella.
 Muhammad · Product Marketing @ Digital Ocean
After trying virtually every management tool out there, I've fully moved my agency to WP Umbrella, and I'm convinced I won't need to look further.
 Kyle · Founder @ The Admin Bar
Every connected site reports into the same dashboard you already open for uptime, updates, and backups. Four severity classes, file and line per error, grouped and counted, mark resolved when you're done.
Yes. Capture starts the moment the WP Umbrella plugin is connected. No host-specific setup, no firewall rules to whitelist, no server-level configuration to negotiate. Verified on Kinsta, WP Engine, Cloudways, SiteGround, and every major shared and managed WordPress host.
WP_DEBUG writes everything to a flat debug.log file inside /wp-content/, which means SSHing in, tailing the file, and grepping, one site at a time. WP Umbrella captures the same surface (Warning, Notice, Parse, Fatal), groups by file and line, counts occurrences, and surfaces them across every site you manage in one dashboard. WP_DEBUG can also accidentally surface output on the front-end if misconfigured. WP Umbrella's capture is silent and out-of-band.
No measurable impact in normal operation. The capture hooks fire on errors that are already being thrown, so they don't add work to the happy path of a page render. Errors are shipped asynchronously to WP Umbrella's infrastructure, so the visitor request doesn't wait on the upload.
Captured errors are stored on EU infrastructure, alongside the rest of your WP Umbrella data. WP Umbrella is GDPR-compliant by default: encrypted at rest, no data selling, EU-based storage, with a DPA available for agencies who need one.
Notifications split by severity, and the honest answer is there are two failure modes you have to choose between. Alert on every Warning and Notice and you'll get noise you'll learn to ignore, then miss the Fatal that mattered. Alert only on Fatal and Parse and you'll catch the breakage but miss the slower-burning Warnings that often precede it. WP Umbrella lets you set the notification threshold per project, so most agencies put noisy sites on Fatal-only and treat the dashboard as the queue for everything else.
No. The 14-day trial is full access to every WP Umbrella feature, including PHP error monitoring across as many sites as you want to connect during the trial. No card at signup, no auto-billing surprise at the end. If you don't pick a plan, sites just disconnect.
Trusted by 80,000+ sites (as of October 2026)
WP Umbrella is designed to grow with your care business, from your first maintenance clients to a mature, multi-site operation.