
WordPress Security Dashboard for Agencies: Manage Security Across All Client Sites
Introducing the bulk security management dashboard. Monitor vulnerabilities, PHP versions, Site Protect status & protection coverage without manual audits.


WP Umbrella’s security dashboard gives agencies a single view of security across every client WordPress site: known vulnerabilities aggregated by severity, PHP versions measured against the WordPress recommendation, Security add-on coverage, and a global protection score for the whole portfolio. Underneath it, each site carries its own Security tab for the detail work.
This page is the operating manual. It covers what each signal means, the filters and bulk actions that turn visibility into finished work, and the weekly cadence that keeps a growing portfolio at one security baseline without site-by-site checks.
Why a security dashboard is critical in agency workflows
Once an agency manages more than a small number of sites, WordPress security monitoring stops being task-based and becomes coordination-based. The issue is no longer whether your team knows how to update PHP versions or review vulnerability reports. It is whether those checks happen consistently across all sites, especially the ones added recently or touched less often.
In practice, attention clusters around active projects. Sites under development get reviewed closely while stable sites drift. Over time this creates uneven coverage, even with good intentions. Responsibility exists, but visibility does not.
The volume makes that drift expensive. Patchstack documented 11,334 new WordPress vulnerabilities in 2025, a 42% increase over 2024. Nobody reads that stream site by site.
The security dashboard addresses this exact breakdown. It lets you confirm, at any moment, whether your security standards hold across the entire portfolio, not just the sites currently in focus.
Also read: 30+ WordPress Security Best Practices in 2026
What the security dashboard shows
The dashboard works in two layers. The visibility layer comes with every WP Umbrella plan: vulnerability detection, PHP version tracking, and Site Health warnings. The protection layer is the Security add-on: firewall, hardening, and the security activity log.
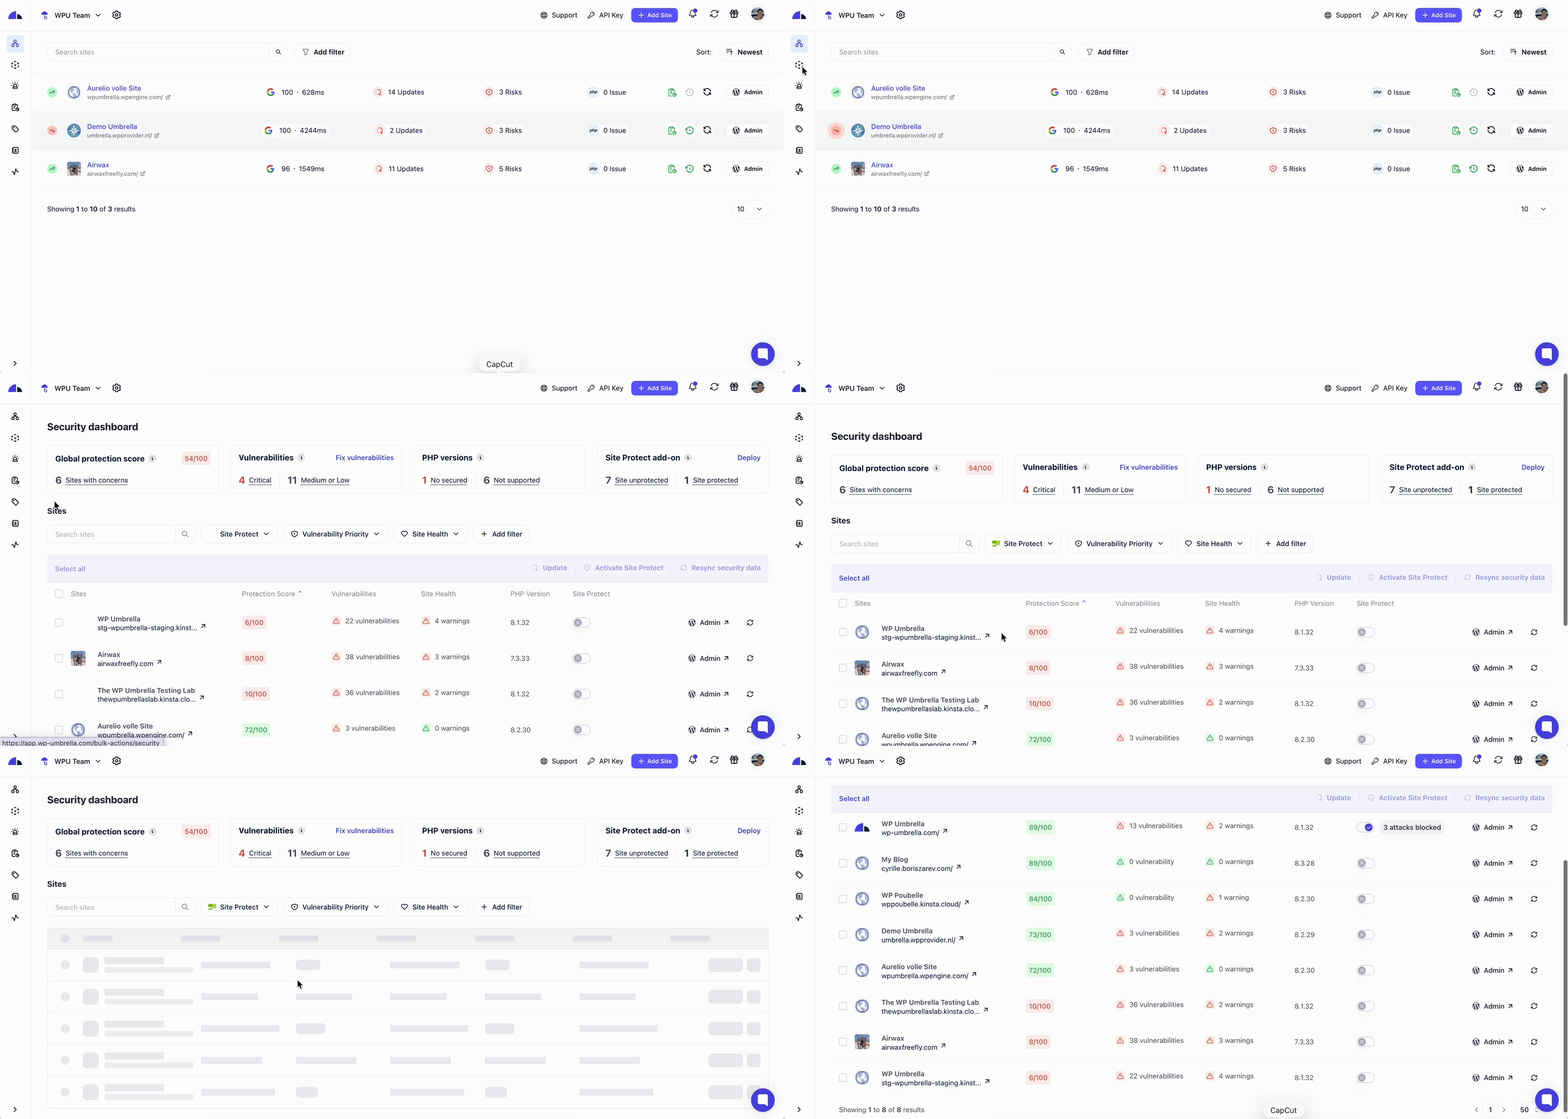
At the fleet level, the bulk view aggregates four signals across all sites. At the site level, a Security tab breaks the same picture down into Site Health, Vulnerabilities, Firewall, Hardening, and Activity Log sections, with malware scanning marked as coming.
1. Known vulnerabilities
Known vulnerabilities are publicly documented security issues affecting WordPress plugins, themes, or WordPress core. Each vulnerability is classified by severity, which reflects how easily it can be exploited and the potential impact if exploitation occurs. This allows agencies to distinguish between issues that require immediate attention and those that can be scheduled.

The dashboard aggregates these vulnerabilities across all sites, so exposure can be assessed at the portfolio level rather than site by site.
Detection is part of every plan, not the add-on. Sites are checked against Patchstack’s database every 6 hours. Known issues are grouped by plugin and theme, ranked by severity, and when an update fixes one, the fix is one click away.
A resolved counter and an on-demand re-scan keep the list honest. Warnings you have consciously accepted, like a PHP version pinned by the host, can be dismissed, so the panel stays a real to-do list.
2. PHP versions
The PHP versions section shows which sites are running the PHP version currently recommended by WordPress, as well as how many sites are not aligned with that recommendation.
This view is particularly relevant in environments where hosting configurations vary or PHP upgrades are handled inconsistently. Instead of relying on periodic audits, agencies can see immediately whether PHP version alignment is being maintained across their sites.
3. Security add-on coverage
The Security add-on is WP Umbrella’s protection layer, and the coverage view shows exactly where it is running: how many sites have it enabled and how many remain unprotected, so coverage gaps surface at a glance.
The add-on has three components: a firewall with virtual patching, powered by Patchstack, security hardening toggles, and a security-driven activity log. Virtual patching blocks the exploitation of known vulnerabilities at the application level, before you have had a chance to update. If the mechanism is new to you, start with what virtual patching is and how it works.
The firewall side includes an insights view: attacks blocked, top offending IPs, top rules triggered. That gives you evidence for client conversations, not just a toggle that says protected.
More than 10,000 sites run the Security add-on today. Enabling it fits how agencies work: in bulk from the main dashboard or the security bulk view, or site by site from the Security tab.
The add-on requires a paid WP Umbrella plan and costs 2 EUR or 2 USD per site per month. For how that price builds into care plan margins, read the Security add-on pricing guide. For the deeper story on stopping exploits before updates ship, meet the Security add-on.
If you knew this layer as Site Protect: same add-on, renamed in July 2026, with hardening and the activity log added to the original firewall. Details in the FAQ below.
4. Global protection score
The global protection score estimates how exposed your sites are to known security risks. It does not indicate whether a site has been hacked.
The score is based primarily on the presence and severity of known vulnerabilities. It also takes into account PHP and WordPress versions, site configuration issues, and whether the Security add-on’s virtual patching is enabled. The purpose is to provide a high-level indication of overall exposure, helping agencies track whether their security posture is improving or degrading over time.
The security activity log: a cross-site audit trail
The security-driven activity log is the add-on component that records what actually happens on your sites. It detects on-site attack behavior: brute-force and credential-stuffing sign-in attempts, mass content deletion, privilege escalation, sign-ins from unusual locations, file integrity changes, and changes to critical settings.
Every detection carries its evidence: the accounts involved, the IP addresses, and a timeline of what happened when. When a client asks what happened to their site on Tuesday, you answer with dated facts instead of reconstruction.
Do not confuse it with WP Umbrella’s included Activity Log. That one records what happens inside the platform itself: who updated which plugin, when a backup ran. The security-driven log watches the WordPress sites themselves. One is your team’s process record; the other is your attack record.
Across a portfolio, that becomes an audit trail. Each site’s Security tab holds its own log, and reviewing them folds into the weekly cadence covered below. For agencies that report security work to clients, this is the raw material: real detections, with evidence, on the client’s own site.
Hardening posture across the portfolio
Hardening is the add-on’s second component: per-site toggles that close common WordPress attack surface at the application and .htaccess level. The first batch of toggles shipped in July 2026, and more are coming.
The portfolio question is not whether one site is hardened. It is whether every site is hardened the same way. Each site’s Security tab carries a Hardening view that works like a checklist: what is on, what is off, decided per site and visible at review time.
That checklist framing is the operator value. When you onboard a new client site, run down the toggles as part of setup, the same way you configure backups and monitoring. For the existing portfolio, review hardening during scheduled care plan work rather than as a special project.
This is deliberately not a hardening tutorial. Which toggles fit which site depends on the site: a WooCommerce store and a brochure site tolerate different restrictions. What the dashboard gives you is the ability to see and set posture consistently, instead of remembering what you did on site 47.
Filtering and bulk actions in WP Umbrella’s security dashboard

Below the global overview, the dashboard shifts from visibility to action.
Filters for focused review
Filters narrow the site list by Security add-on status, vulnerability priority, or site health signals. That turns a portfolio-wide review into a short, specific list: every site without the add-on, every site carrying a critical vulnerability, every site flagged by site health.
Use them when responding to a specific class of risk, or to structure routine reviews so each pass has one question to answer.
Bulk actions
Select the filtered sites and act on all of them at once. From the bulk view you can enable the Security add-on, trigger updates, or resynchronize security data across the selection, without moving site by site. The work stays in your hands; the repetition does not.
Ready to run security from one place? See every client site’s vulnerabilities, PHP versions, and protection coverage in a single dashboard, and fix what needs fixing in bulk. Start your free trial. No credit card required.
Where this sits in a layered security stack
WordPress security runs in layers. At the edge, a firewall like Cloudflare’s WAF filters hostile traffic before it reaches your sites. At the server layer, your host handles isolation and server hardening. WP Umbrella works at the application layer: virtual patching, hardening, and detection inside WordPress itself.
The add-on prevents the exploitation of known vulnerabilities. It does not clean a site that is already infected, and malware scanning is marked as coming to the Security tab. Keep your update discipline and your backups; the layers complement each other.
What it does replace is the pile of single-purpose security plugins at the application layer. If you are weighing that pile, see the security plugin comparison.
How the security dashboard changes day-to-day security management
The dashboard replaces periodic manual audits with a standing cadence. Here is the operating rhythm it supports.
1. Start the week at green
Open the bulk security view on Monday morning, before client work starts. You are reading four numbers: new vulnerabilities by severity, PHP alignment, add-on coverage, and which way the global protection score moved. If everything holds, the check costs two minutes and you move on.
If something moved, you found it on Monday, while it is still routine maintenance instead of an incident with a client on the phone. That timing difference is most of the dashboard’s value.
2. Track patch compliance and time-to-remediation
Two numbers describe whether your security operation works: how many known vulnerabilities are open across the portfolio, and how long they stay open. The dashboard gives you both. Vulnerabilities arrive aggregated by severity, and the resolved counter shows the work completing.
Most fixes are updates, one click from the vulnerability list. Where a fixed version does not exist yet, virtual patching covers the sites running the add-on while you wait. Time-to-remediation is also the number worth showing clients: not whether issues appear, because they always do, but how fast they close.
3. Triage by severity, not by memory
When reviews happen site by site, prioritization runs on memory: recently touched sites get attention, stable ones drift. The dashboard makes priority explicit. Critical vulnerabilities get handled today, high severity this week, and the rest lands in scheduled maintenance.
Filters make the triage concrete: pull the list of sites carrying critical vulnerabilities, resolve it, then widen. Attention distributes by risk, not by recency.
4. Review the activity log before clients ask
Once a week, skim the security activity log for detections across the portfolio: sign-in attacks, privilege escalations, file changes. Most weeks it confirms quiet. The weeks it does not, you have the account, the IP, and the timeline before anyone asks.
This is also where security becomes reportable. Detections with evidence, on the client’s own site, turn a care plan line item into something the client can see.
Frequently asked questions about backup plugins
It is the portfolio-wide security view: known vulnerabilities, PHP versions, Security add-on coverage, and the global protection score for every connected WordPress site in a single interface, instead of site-by-site checks. Agencies and freelancers managing many client sites use it as their fleet-level control surface.
Through centralized visibility plus bulk action. WP Umbrella’s security dashboard centralizes known vulnerabilities, PHP versions, the global protection score, and Security add-on status. Without a centralized dashboard, security management relies on manual audits, individual site checks, or fragmented alerts from plugins and hosting providers.
WP Umbrella’s security dashboard surfaces PHP version data for all connected sites in one place, measured against the version WordPress currently recommends. This avoids logging into individual hosting dashboards or running periodic manual audits.
The Security add-on is WP Umbrella’s paid protection layer: a firewall with virtual patching powered by Patchstack, a malware scanner, security hardening toggles, and a security-driven activity log. The full explainer: stop WordPress vulnerabilities before they are exploited.
It estimates how exposed a WordPress site is to known security risks based on its current state. Each site starts with a score of 100, and points are removed based on specific, observable risk factors. A lower score means higher exposure to known vulnerabilities or misconfigurations, not an active compromise; it never indicates whether a site has been hacked. Learn more about the global protection score.
Conclusion
The security dashboard is an instrument for consistency. It answers, at any moment, whether every client site meets the same baseline: vulnerabilities handled, PHP aligned, protection enabled, posture hardened, detections reviewed. The answer comes from one screen instead of a manual audit.
As the portfolio grows, that consistency is what scales. The cadence above works the same at 30 sites and at 300; only the numbers on the screen change.
Visibility also earns money when clients understand it. Up next: a complete guide to selling site protection to clients.