Debugging WordPress with WP_DEBUG and WP_DEBUG_LOG
This guide is designed to describe all major aspects of WP_Debug & WP_Debug_log so you can enable WordPress debugging.

WordPress comes with a special debug system (WP_DEBUG_LOG & WP_DEBUG) designed to simplify the debugging process throughout the core, plugins, and themes while standardizing code across them.
Whenever WordPress debug is enabled, it will log any errors found on your site. You can use this to figure out the source of a problem or to learn more details about potential errors on your site.
The debug mode of WordPress can be activated in the wp-config.php file through the activation of the WP_DEBUG_LOG and WP_DEBUG_DISPLAY constants.
In this article, we’ll tell you all you should know about these two WordPress constants, and also when to use SCRIPT_DEBUG and SAVEQUERIES, so you can have all the information you need to troubleshoot WordPress sites.

WP_DEBUG, WP_DEBUG_LOG & WP_Debug_Display
Is a powerful combination to help you improve the quality of your code or identify poorly coded WordPress plugins or themes.
Monitor PHP errors and much with WP Umbrella
Install WP Umbrella on your websites in a minute and discover a new way to manage multiple WordPress sites.
Get Started for free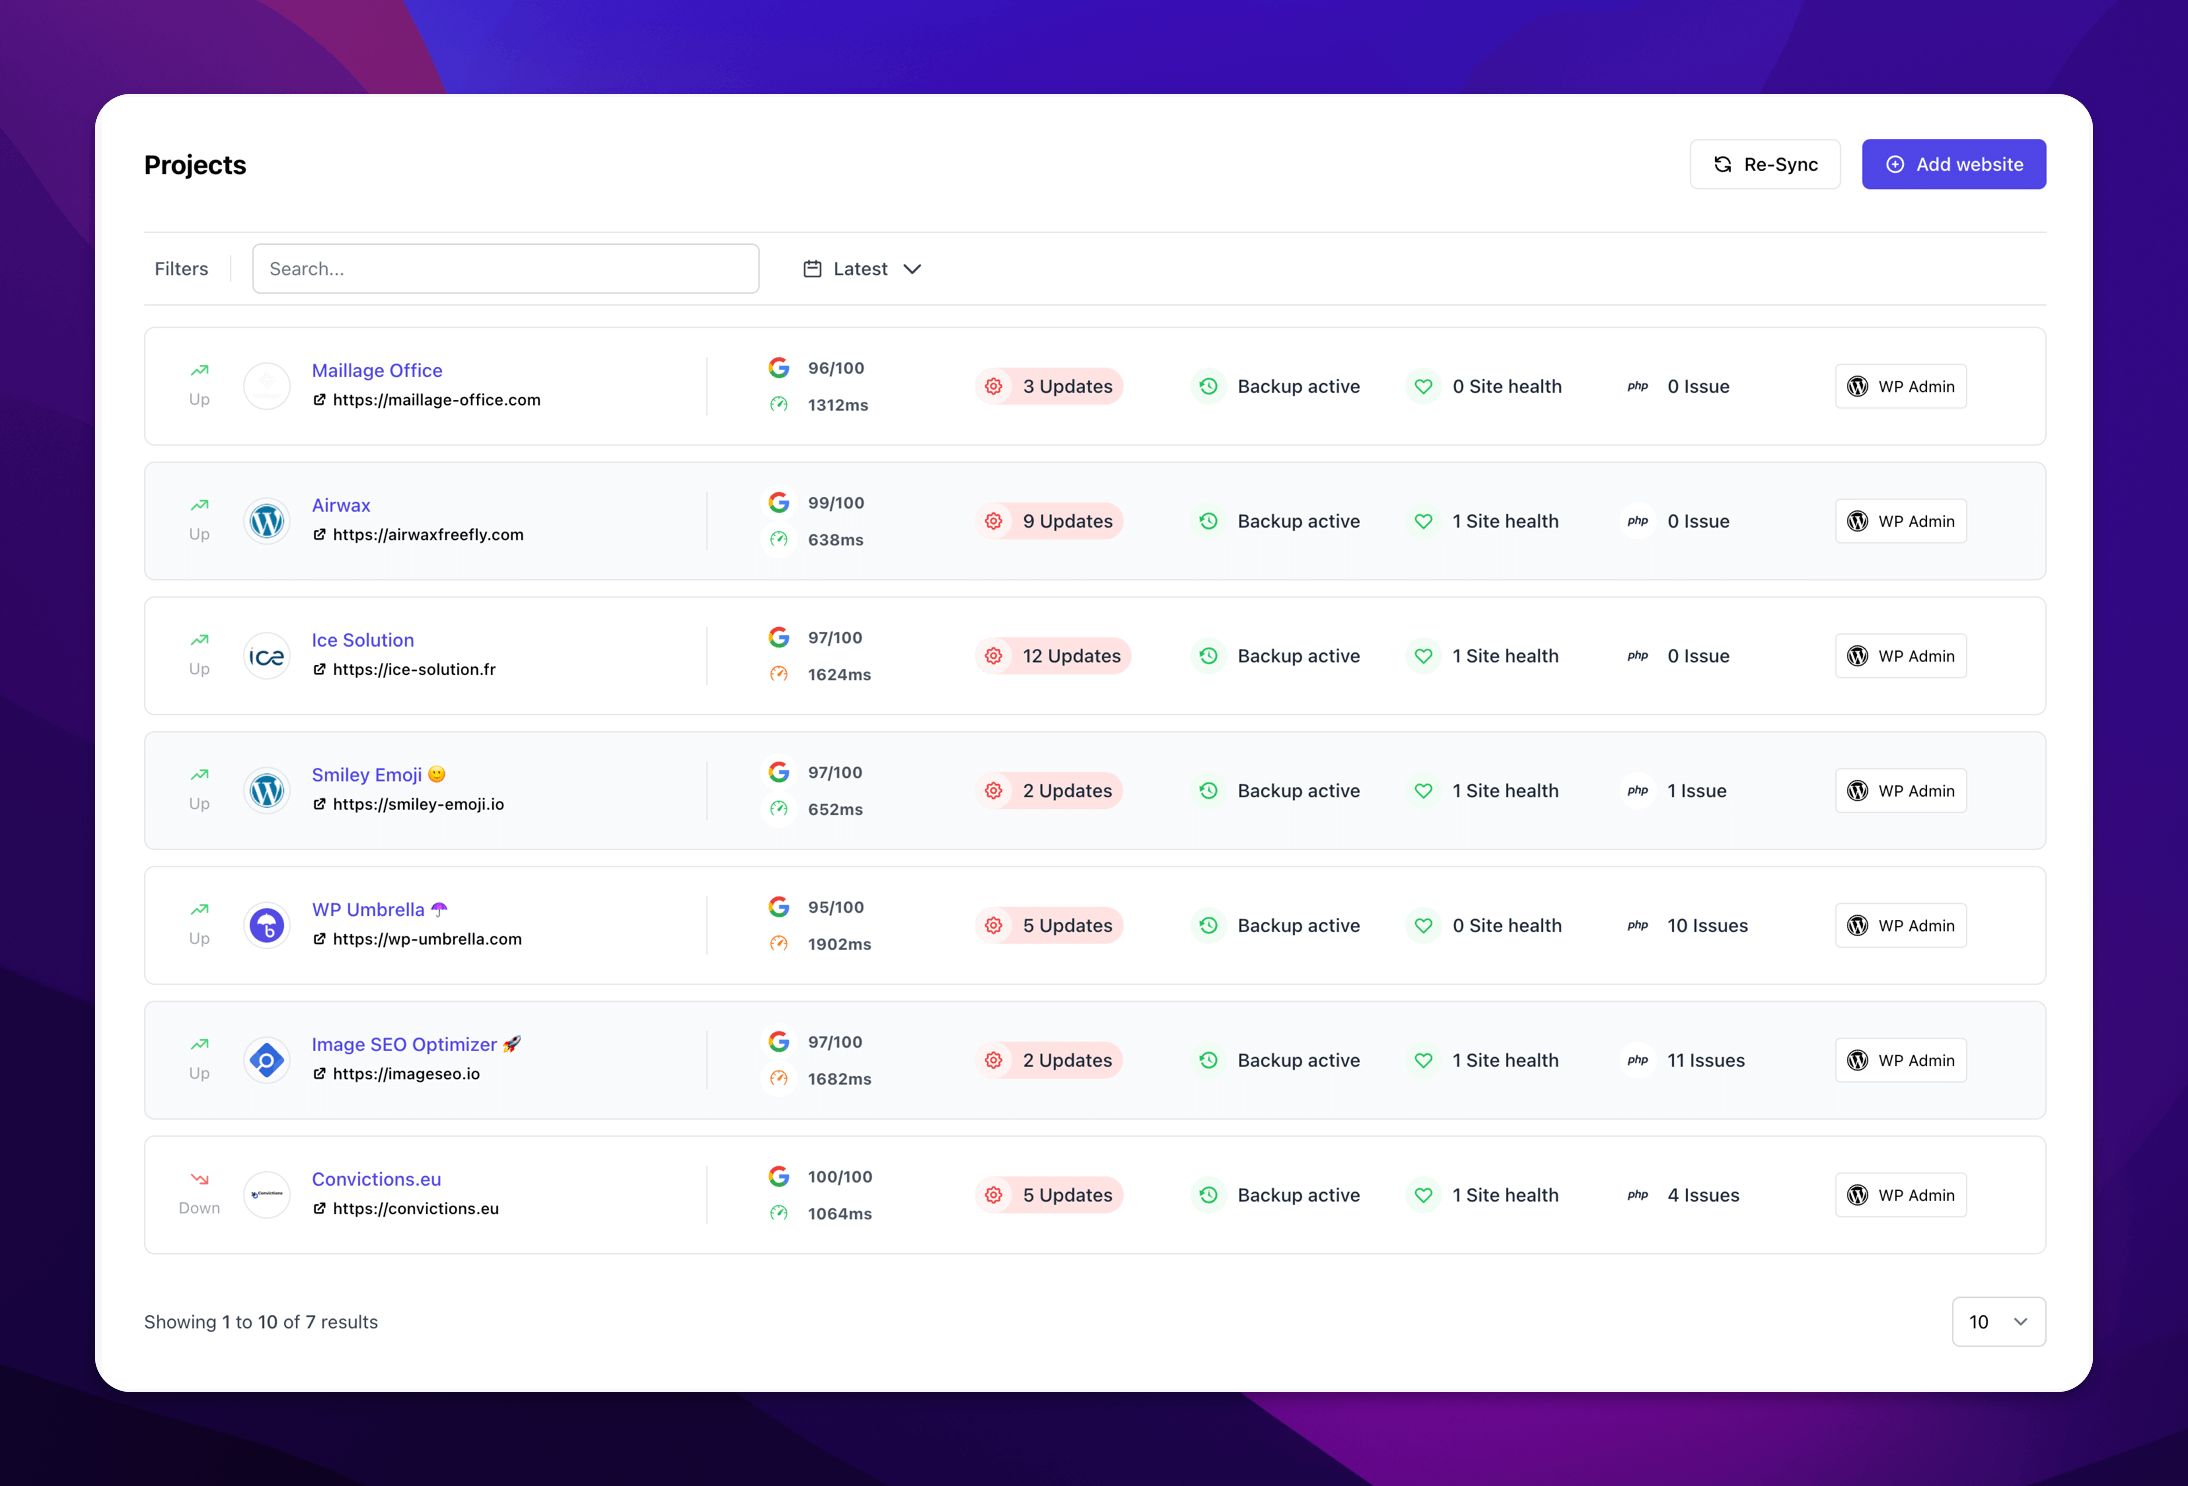
Why is Debugging Important in WordPress?
Before you even think about debugging, you might wonder, why is it even essential?
Debugging is essential for identifying and resolving PHP errors and warnings that may not be visible on the front end and offer many insights:
- Improve site performance: Identify problematic code that slows down your site with multiple requests.
- Enhance security: Discover and fix vulnerabilities in your themes or plugins.
- Increase code quality: Maintain a clean, error-free codebase that will last over time.
If you don’t utilize WordPress debug tools, you’re essentially working in the dark and potentially allowing issues to snowball into bigger problems.
If you’d rather not deal with WordPress debugging constants, WP Umbrella has you covered. It automatically logs PHP errors, so you don’t have to lift a finger. It also make the debug log more user friendly.
Debugging WordPress With Five PHP Constants
Add these 5 lines of code to your WP-Config.php file to fully enable WordPress debug mode.
define( 'WP_DEBUG', true );
define( 'WP_DEBUG_LOG', true );
define( 'WP_DEBUG_DISPLAY', false );
define( 'SCRIPT_DEBUG', true );
define( 'SAVEQUERIES', true );
WP_DEBUG: What It Is And How To Enable It
WP_DEBUG is a PHP constant that enables the “debug” mode in WordPress. By default, WP Debug should be set FALSE so hackers can’t get access to precious information about your website health.
This means that WP_DEBUG should only be set TRUE when you are debugging a website or on local testing and staging installs. Using WP_DEBUG on a live site is not recommended.
You can change the value of WP_DEBUG in the wp-config.php file.
define( 'WP_DEBUG', true );When WP_DEBUG is enabled, all PHP errors, notices, and warnings will be displayed.
If you show all PHP notices and warnings, you may get error messages for things that appear to work, but do not follow PHP’s data validation conventions.
Getting rid of these warnings is easy once the relevant code has been identified, and the resulting code is almost always more bug-resistant and easier to maintain.
Working code, happy customers!
WP_DEBUG_LOG: What It Is And How To Enable It
The WP_DEBUG_LOG constant enhance WP_DEBUG by logging all errors to a debug.log file. It’s useful if you need to review all notices later or want to view notices that are generated off-screen (for example, during an AJAX request).
By default, the debug.log file is saved in the content directory (generally wp-content/debug.log) of your website.
If you want to record your PHP errors in another file, you can do so by adding this lines of code in your config file:
define( 'WP_DEBUG_LOG', true );
-or-
define( 'WP_DEBUG_LOG', '/yourpath/wp-errors.log' );
To function, WP_DEBUG_LOG needs WP_DEBUG to be set true.
WP_DEBUG_DISPLAY: What It Is And How To Enable It
WP_DEBUG_DISPLAY controls whether debug messages are displayed inside the HTML of pages or not and is an extension to WP_DEBUG.
When set to true, errors and warnings will appear as they are generated. By setting this to false, all errors will be hidden.
WP_DEBUG_LOG should be used in conjunction with this so errors can be analyzed later.
SCRIPT_DEBUG: What It Is And How To Enable It
Using SCRIPT_DEBUG will force WordPress to load native downloads of CSS and JavaScript files instead of the minified versions normally loaded with the theme.
The functionality will help you test modifications to .css or .js files.
By default, the value of SCRIPT_DEBUG is false.
SAVEQUERIES: What It Is And How To Enable It
By using the SAVEQUERIES definition, database queries are saved in an array, which can then be displayed to assist with analyzing them.
By setting the constant to true, each query is saved with the number of seconds it took to execute, as well as the function that called it.
Debugging WordPress With Plugins
If you feel overwhelmed about enabling WordPress debugging yourself, there are a couple of plugins that you can use to do it. The two most famous are WP Umbrella and Query Monitor.
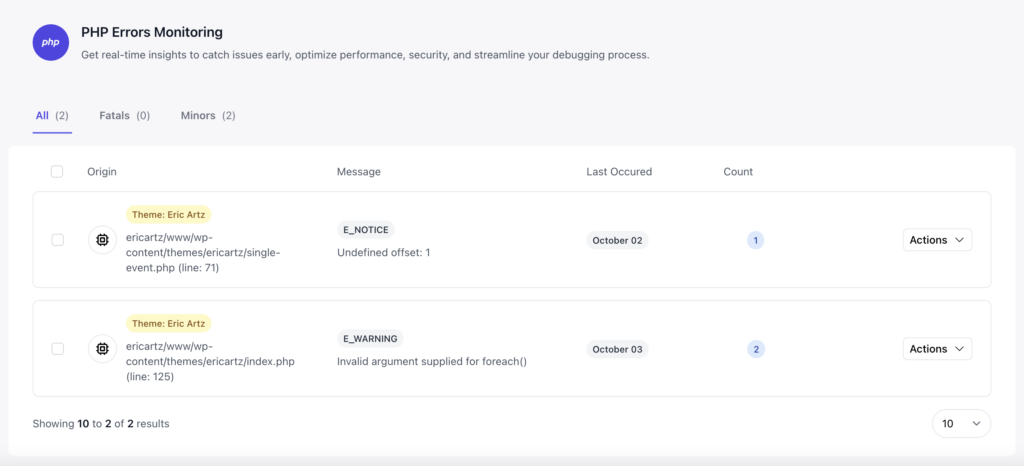
Using WP Umbrella to Monitor PHP Errors in Real Time
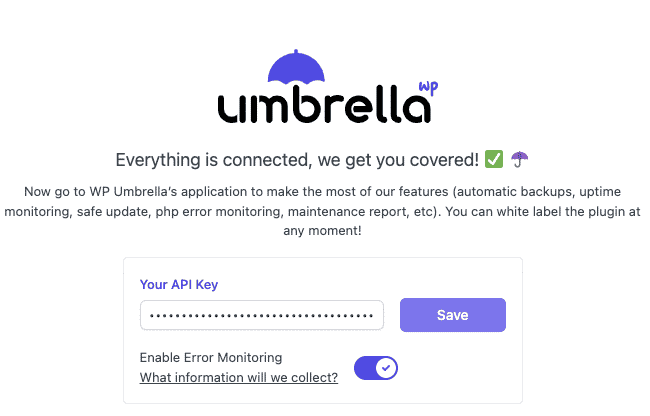
To enable PHP errors monitoring you only need to download, install and activate WP Umbrella on your WordPress website.
Your PHP errors will be monitored and stored in WP Umbrella’s dashboard with all the information you need to know about so you can troubleshoot them easily.

In addition to PHP error monitoring, WP Umbrella also offers daily automatic backup, uptime monitoring, and much more.
Using Query Monitor To Manually Debug WordPress
Query Monitor is a free plugin that helps webmasters analyze page requests on the frontend and backend. Besides giving you many useful reports, it also tells you about critical PHP issues.
A new toolbar item will appear once you have installed and enabled it. Whenever a critical (PHP) error is detected, a red warning appears.

Query Monitor has a drawback: it does not monitor or log PHP errors. You need to browse your website and find the errors yourself so we would recommend you to use WP Umbrella or the WP_DEBUG constants.
FAQ Section
To enable WordPress debugging, you need to add these 3 lines of code to the wp-config.php file:
define( ‘WP_DEBUG’, true );
define( ‘WP_DEBUG_DISPLAY’, false );
define( ‘WP_DEBUG_LOG’, true );
WordPress writes error messages to the debug.log file. This file is located in the /wp-content/ folder.
WP_CACHE is a WordPress constant that allows your website to cache its content. You can enable or disable wp_cache in the wp-config.php file.
You should not debug a WordPress plugin yourself, since your fixes will be erased by the next plugin update. It’s always best to reach out to the plugin support so they can make a permeant fix for everybody.
WordPress has an error log (wp_debug, wp_debug_log) but does not have an activity log. This means that will need an activity log plugin.
Conclusion
Enabling WP_DEBUG and WP_DEBUG_LOG in WordPress is essential for tracking and resolving PHP errors efficiently.
These WordPress constants, along with supplementary plugins like WP Umbrella, ensure that you catch bugs early, improving your site’s performance and stability.
Regular debugging allows for a smoother, more reliable WordPress experience, especially as your site grows and evolves, so keep logging bugs and do not hesitate to look at WordPress Codex for additional ressources.